Ship log files to Grafana and Loki using Promtail - Emby
Shipping file based logs to Grafana and Loki using the Promtail agent.

In a prior post, I went over using Grafana and Loki to aggregate log data directly from Docker containers using the Loki logging driver.
In this post I'm going over taking Emby log files from the local filesystem and shipping them to Grafana and Loki to parse and store using the Promtail agent.
This tutorial is tailored to monitoring Emby log files for the application and ffmpeg logs, however, the configuration is pretty much universal and can intake nearly text based log files.
Getting Started
There are two common choices for running the Promtail agent. Installing the binary from https://github.com/grafana/loki/releases or running the agent using the prebuilt docker image. For this example, I'm going to ship Emby log files using the prebuilt docker image as my environment is tailored to containerization.
Creating the docker-compose.yml and Promtail agent configuration
I'm starting off with creating a new directory to store the compose file and persistent data. I often use bind mounts instead of volumes as a personal preference to match my backup strategy.
mkdir -p /opt/promtail-agent
cd /opt/promtail-agent
nano docker-compose.yml
---
version: "2.1"
services:
promtail:
image: grafana/promtail:latest
container_name: promtail
restart: unless-stopped
volumes:
- ./promtail-config:/etc/promtail
- ./logs:/emby-logs:ro
command: -config.file=/etc/promtail/promtail-config.yaml./docker-compose.yml
We can see that under volumes that the configuration file for the Promtail agent will be stored under './promtail-config'. I'm creating the directory and adding the configuration file. This configuration file will need to be modified to match your environment. Take note to the comments that say "change this".
# port at which promtail will run
server:
  http_listen_port: 9080
  grpc_listen_port: 0

# this is the place where promtail will store the progress about how far it has read the logs
positions:
  filename: /tmp/positions.yaml

# address of loki server to which promtail should push the logs
clients:
  - url: http://<grafana-ip>:3100/loki/api/v1/push # change this

# which logs to read/scrape
scrape_configs:
  - job_name: emby-logfiles # change this
    static_configs:
    - targets: # tells promtail to look for the logs on the current machine/host
        - localhost
      labels: # labels with which all the following logs should be labelled
        job: emby-logs  # change this
        host: emby-server    # change this
        __path__: /emby-logs/*.txt # change this
        # __path__ denotes the path of the actual log file whose logs will be scraped
        # and shipped to loki indexed with the above labels
./promtail-config/promtail-config.yaml
The second bind mount we see in the docker compose file is creating a read-only mount for the actual log file directory which will be monitored by the Promtail agent. This allows Promtail read access to the log files specified in the configuration file.
We can see that in the docker-compose.yml file that the host directory './logs' is mounted in the Promtail agent container as '/emby-logs'.
Run the Promtail agent container
Once the docker-compose.yml file and the Promtail agent configuration file has been created, you're ready to start the compose project.
cd /opt/promtail-agent
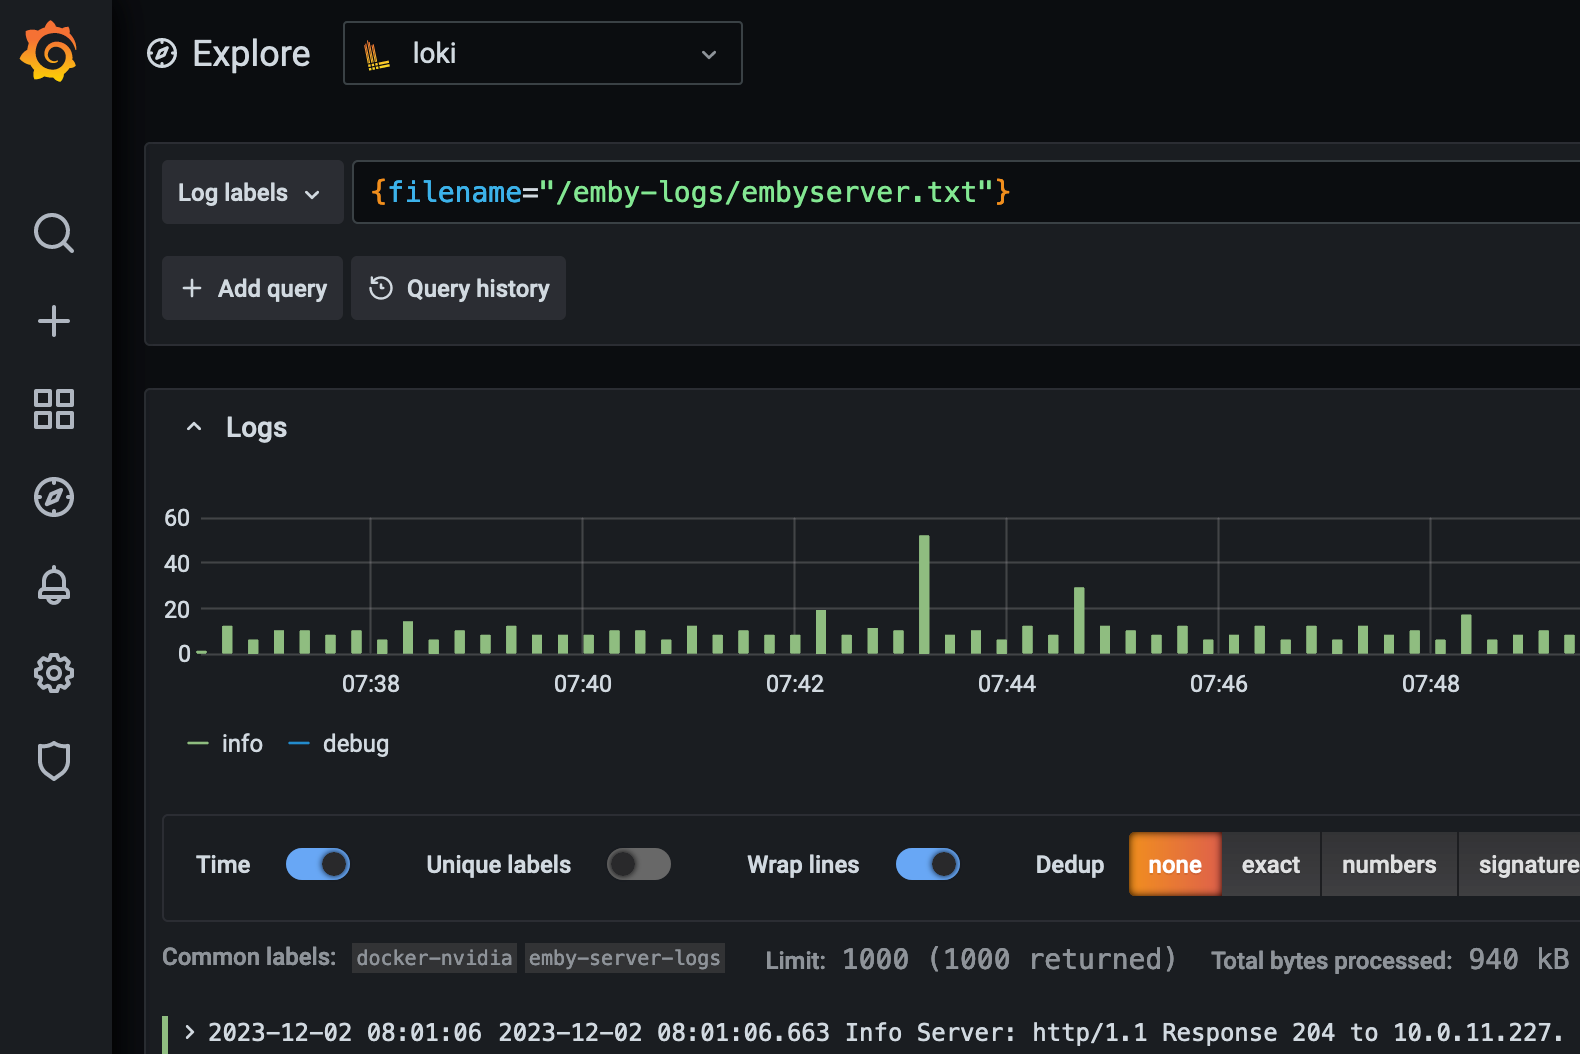
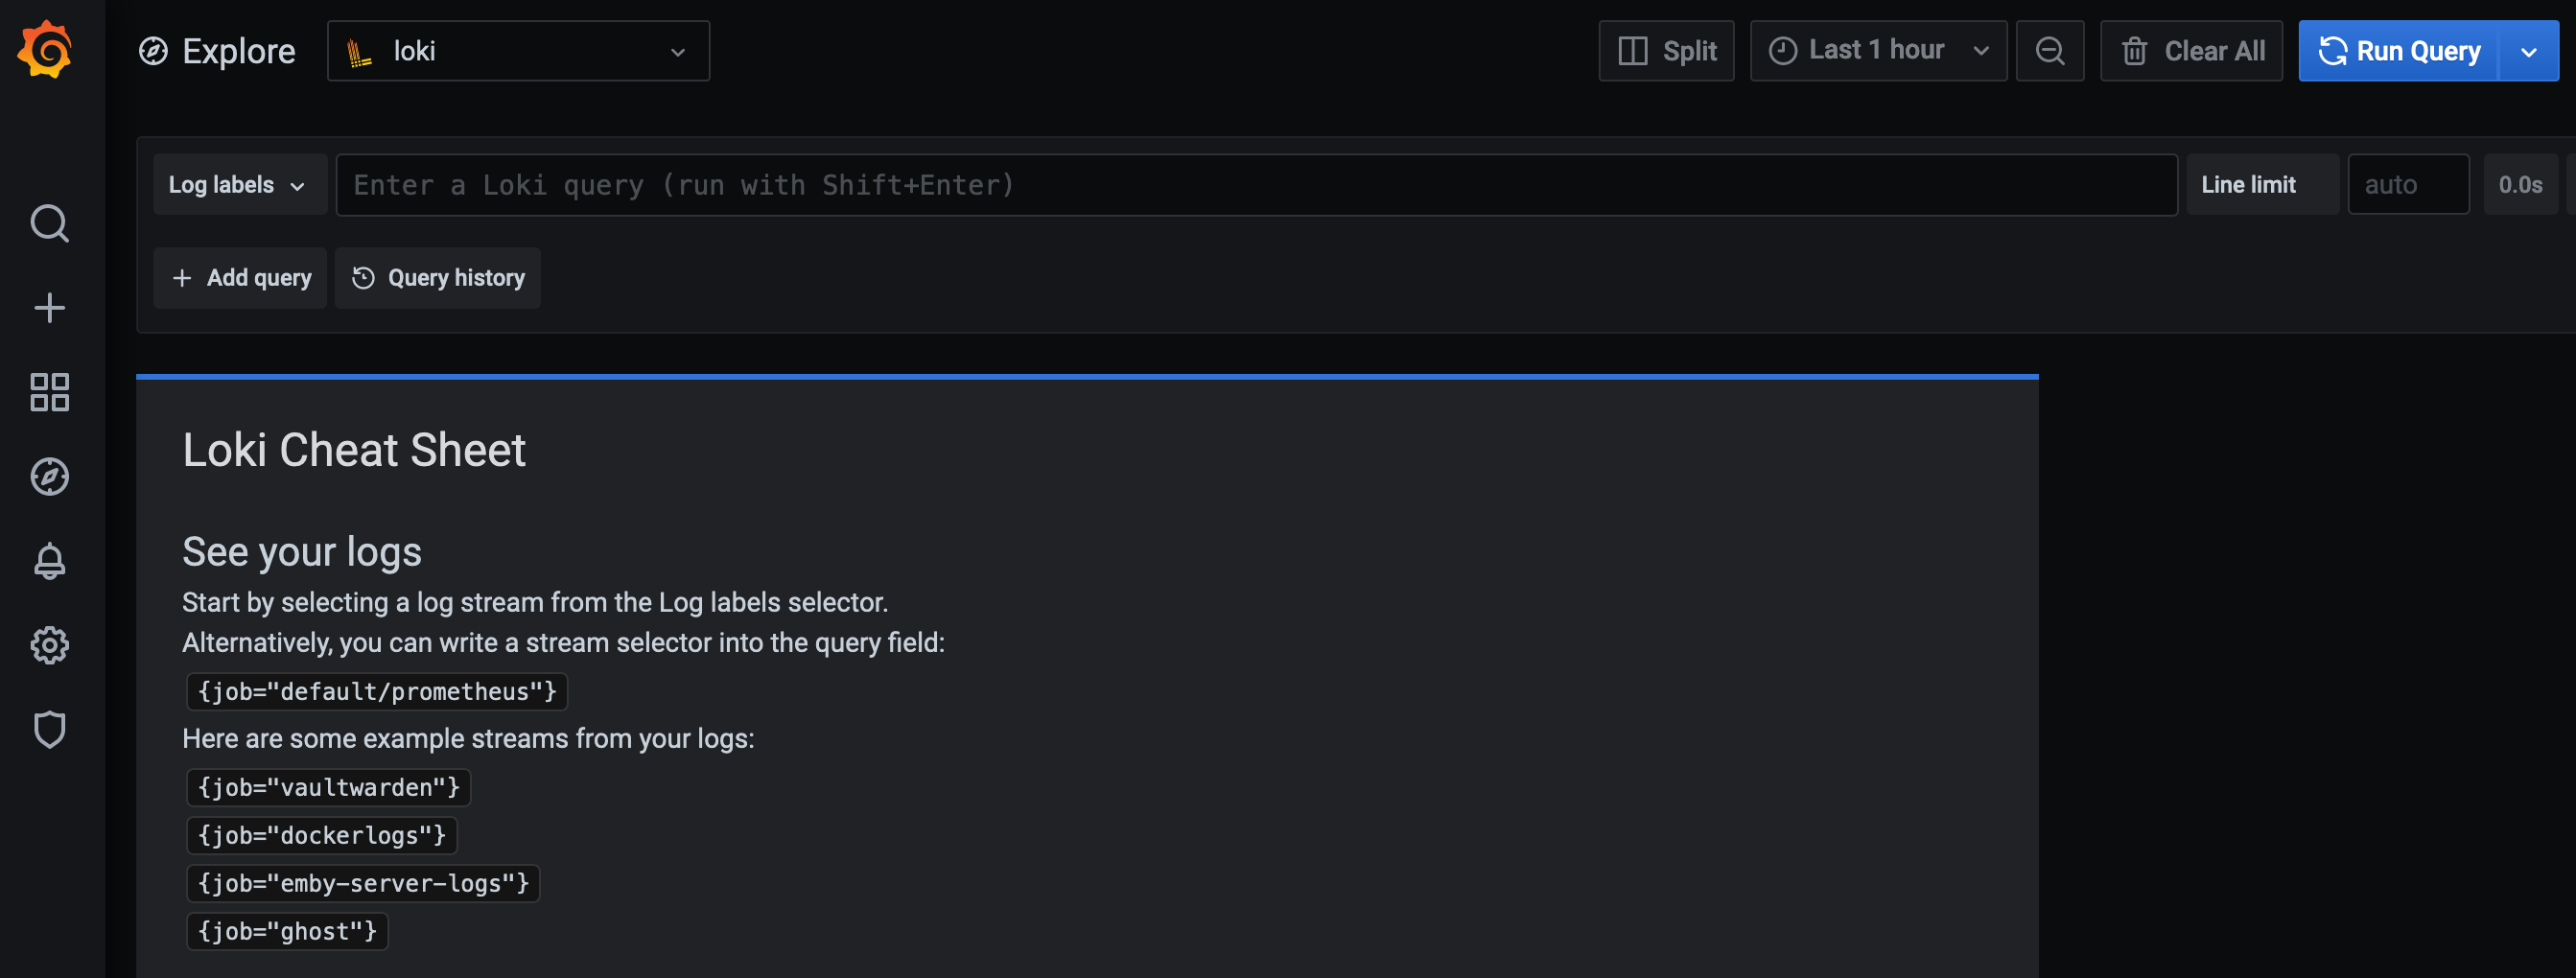
docker compose up -dLog into Grafana and take a look under Explore > log labels > filename. If you dont start to see some data come in for your log filenames, check over the steps above and ensure the Promtail agent can access the log files on the host data storage.